Updated June 29, 2026 — what this article covers
This article explains how solar photovoltaic (PV) systems work, summarizes the current global scale and cost trends, describes major technology advances and environmental trade‑offs, and gives practical tips for homeowners considering rooftop solar. Facts and figures are current as of June 29, 2026 — verify local incentives and regulations before making a purchase.
Quick summary — key facts
- Global cumulative solar PV capacity was about 2.26 terawatts (TW) at the end of 2024, and 2024 saw roughly 553–601 GW of new installations (IEA‑PVPS, Trends 2025).
- Annual additions continued strongly through 2025; some datasets reported end‑2025 capacity in the ~2.38–3.0 TW range (IRENA, Renewable Capacity Statistics 2025).
- Costs have fallen sharply over the last 15+ years; utility PV now ranks among the lowest LCOE options in many regions (Lazard, LCOE v18, 2025).
- Life‑cycle GHG emissions for crystalline silicon PV are typically in the low tens of grams CO2e per kWh (NREL LCA harmonization, 2025).
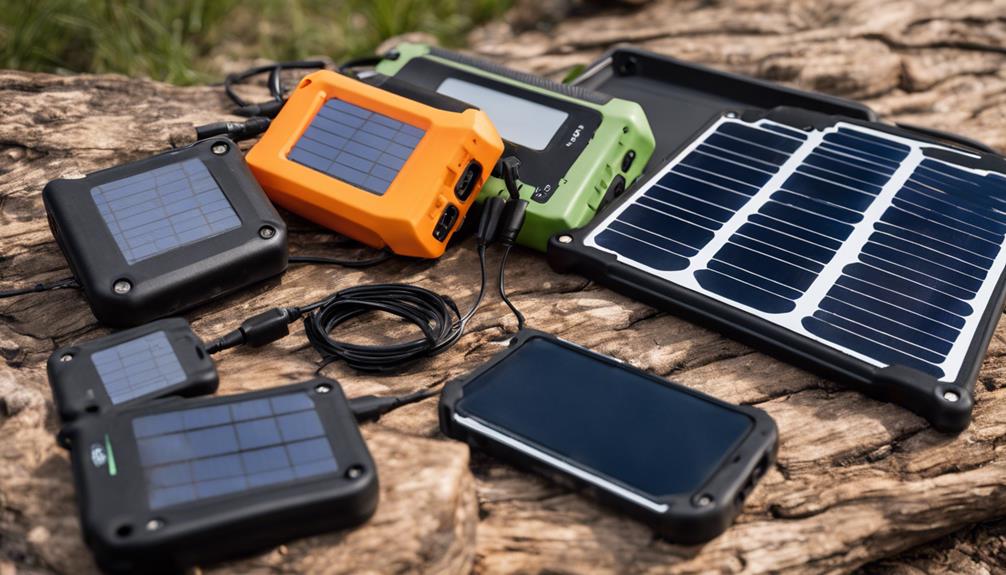
How solar PV works (simple explanation)
Solar photovoltaic (PV) systems convert sunlight into electricity using semiconductor solar cells. Photons in sunlight free electrons inside a solar cell; those electrons flow as direct current (DC). Multiple cells are packaged into a solar module (panel), and modules are connected into an array. An inverter converts DC to alternating current (AC) for home or grid use. A complete system also includes racking/mounting, wiring, monitoring equipment, and—on many installations—a safety disconnect and meter.
Common system types: distributed (rooftop) PV for homes and businesses, and utility‑scale PV farms that feed the grid. Many systems now pair PV with battery storage (solar‑plus‑storage) so solar output can be shifted to evening hours.
Current scale & growth (recent trends)
Solar is the fastest‑growing power source globally. Global cumulative installed PV capacity reached about 2.26 TW at end‑2024, with 2024 itself a record year adding roughly 553–601 GW (IEA‑PVPS, Trends 2025). Industry and IRENA datasets reported continued large additions through 2025, with some summaries putting end‑2025 totals between ~2.38 TW and approaching 3.0 TW (IRENA, Renewable Capacity Statistics 2025).
Growth has come from both utility‑scale projects and distributed rooftop installs. Markets vary: a few countries lead additions, while many more are scaling up deployment through auctions, corporate procurement, and household solar programs.
Costs & economics
Solar module prices and overall system costs have fallen dramatically over the past decade and a half. Lazard’s LCOE analyses (v18, 2025) show utility PV among the lowest‑cost sources in many markets when compared on a levelized cost basis. Actual costs vary by region, project size, permitting complexity, interconnection costs, and financing.
For homeowners, incentives (tax credits, rebates, net metering) and electricity prices determine payback times. Where retail electricity rates are high and incentives exist, payback periods can be under a decade; in other places, the horizon may be longer. Always check current local incentives and consult multiple installer quotes (last checked June 29, 2026).
Technology & near‑term innovation
Crystalline silicon (c‑Si) dominates manufacturing today. Incremental cell and module improvements—PERC, TOPCon, heterojunction, and bifacial modules—have steadily raised module efficiencies and reduced costs. Research and early commercialization efforts are focused on silicon‑perovskite tandem cells, which aim to push module efficiency beyond single‑junction silicon limits. NREL reported in 2025 that improving tandem efficiency could significantly lower module cost per watt if reliability and scaling challenges are solved (NREL, 2025).
Expect incremental efficiency gains from c‑Si over the near term and growing demonstrations of tandems and advanced cell architectures as they move toward commercial scale.
Grid integration & storage
Solar output is variable by time of day and weather. Integrating large shares of solar requires grid flexibility: more transmission, demand response, and energy storage. Battery storage paired with PV (solar‑plus‑storage) is growing rapidly, but cumulative storage capacity still trails PV capacity by a wide margin (IRENA Coalition report, 2025). Wider deployment of storage, improved forecasting, and market design changes are key to reliable high‑solar systems.
Environmental & lifecycle impacts
Over its lifecycle, utility‑scale crystalline silicon PV typically emits low tens of grams CO2e per kWh — an order of magnitude lower than coal or gas generation in most regions (NREL LCA harmonization, 2025). However, PV manufacturing requires energy and materials (polysilicon, glass, aluminum, copper) and produces waste streams. End‑of‑life management and recycling are becoming important policy topics; recycling rates and infrastructure are improving but are not yet universal.
Supply chain & policy risks
A large share of PV manufacturing (polysilicon, wafers, cells, modules) is concentrated in China. This concentration has helped push costs down but creates geopolitical and supply‑chain risks (IEA, Solar PV Global Supply Chains, 2024). Policymakers and industry are responding with diversification strategies, incentives for local manufacturing, and trade measures. At the same time, regions such as the EU are advancing rules on producer responsibility and module recycling (EU WEEE updates, 2023–2024).
Outlook — near term
Expect continued rapid deployment, further cost declines in many markets, wider uptake of solar‑plus‑storage, and incremental efficiency improvements from established silicon tech. Key uncertainties include trade and raw‑material policies, module supply‑chain stability, and the pace of recycling infrastructure scale‑up (forecasts and market conditions as reported through 2025–2026: IEA, IRENA, NREL).
Practical tips — homeowner checklist
- Get at least three installer quotes and compare system size, expected production (kWh/yr), equipment warranties, and inverter/monitoring options.
- Confirm whether savings assumptions use gross or net metering and check local interconnection rules and utility rates (last checked June 29, 2026).
- Inspect installer credentials: local licensing, certifications (e.g., NABCEP where relevant), and insurance.
- Ask about module recycling or buy‑back programs and long‑term O&M expectations.
- Don’t rely solely on payback estimates — understand contract terms, escalation clauses, and maintenance responsibilities.
Note: this is general information, not individualized financial or legal advice. For tax or incentive questions, consult official government resources or a qualified advisor.
Suggested visuals
- Simple schematic of a rooftop PV system (cells → module → inverter → meter/grid).
- Global cumulative PV capacity growth chart (2010–2025).
- Cost decline graph (module price or LCOE trend since 2009).
- Schematic of silicon‑perovskite tandem cell concept.
- One‑page homeowner checklist infographic.
Sources & further reading (selected)
- IEA‑PVPS, Trends in Photovoltaic Applications (Trends 2025) — global deployment statistics (IEA‑PVPS, 2025).
- IRENA, Renewable Capacity Statistics 2025 — capacity datasets (IRENA, 2025).
- Lazard, Levelized Cost of Energy (LCOE) analysis, v18 (2025).
- NREL, reports on perovskite/silicon tandems and PV life‑cycle GHG harmonization (NREL, 2025).
- IRENA Coalition report, Solar and Storage key enablers (2025).
- IEA, Solar PV Global Supply Chains executive summary (2024).
- EU Council / WEEE amendments on e‑waste and producer responsibility (2023–2024).
Last checked June 29, 2026. For the latest national/regional rules and incentives, consult your local energy authority or official government websites.


 respond to the energy crisis: benefits, limits, and what homeowners should know")